Monday, June 25, 2012

Building and profiling high performance systems with Iago

Iago is a load generator that we created to help us test services before they encounter production traffic. While there are many load generators available in the open source and commercial software worlds, Iago provides us with capabilities that are uniquely suited for Twitter’s environment and the precise degree to which we need to test our services.

There are three main properties that make Iago a good fit for Twitter:

  • High performance: In order to reach the highest levels of performance, your load generator must be equally performant. It must generate traffic in a very precise and predictable way to minimize variance between test runs and allow comparisons to be made between development iterations. Additionally, testing systems to failure is an important part of capacity planning, and it requires you to generate load significantly in excess of expected production traffic.
  • Multi-protocol: Modelling a system as complex as Twitter can be difficult, but it’s made easier by decomposing it into component services. Once decomposed, each piece can be tested in isolation; this requires your load generator to speak each service’s protocol. Twitter has in excess of 100 such services, and Iago can and has tested most of them due to its built-in support for the protocols we use, including HTTP, Thrift and several others.
  • Extensible: Iago is designed first and foremost for engineers. It assumes that the person building the system will also be interested in validating its performance and will know best how to do so. As such, it’s designed from the ground up to be extensible – making it easy to generate new traffic types, over new protocols and with individualized traffic sources. It is also provides sensible defaults for common use cases, while allowing for extensive configuration without writing code if that’s your preference.


Iago is the load generator we always wished we had. Now that we’ve built it, we want to share it with others who might need it to solve similar problems. Iago is now open sourced at GitHub under the Apache Public License 2.0 and we are happy to accept any feedback (or pull requests) the open source community might have.

How does Iago work?

Iago’s documentation goes into more detail, but it is written in Scala and is designed to be extended by anyone writing code for the JVM platform. Non-blocking requests are generated at a specified rate, using an underlying, configurable statistical distribution (the default is to model a Poisson Process). The request rate can be varied as appropriate – for instance to warm up caches before handling full production load. In general the focus is on the arrival rate aspect of Little’s Law, instead of concurrent users, which is allowed to float as appropriate given service latency. This greatly enhances the ability to compare multiple test runs and protects against service regressions inducing load generator slow down.

In short, Iago strives to model a system where requests arrive independently of your service’s ability to handle them. This is as opposed to load generators which model closed systems where users will patiently handle whatever latency you give them. This distinction allows us to closely mimic failure modes that we would encounter in production.

Part of achieving high performance is the ability to scale horizontally. Unsurprisingly, Iago is no different from the systems we test with it. A single instance of Iago is composed of cooperating processes that can generate ~10K RPS provided a number of requirements are met including factors such as size of payload, the response time of the system under test, the number of ephemeral sockets available, and the rate you can actually generate messages your protocol requires. Despite this complexity, with horizontal scaling Iago is used to routinely test systems at Twitter with well over 200K RPS. We do this internally using our Apache Mesos grid computing infrastructure, but Iago can adapt to any system that supports creating multiple JVM processes that can discover each other using Apache Zookeeper.

Iago at Twitter

Iago has been used at Twitter throughout our stack, from our core database interfaces, storage sub-systems and domain logic, up to the systems accepting front end web requests. We routinely evaluate new hardware with it, have extended it to support correctness testing at scale and use it to test highly specific endpoints such as the new tailored trends, personalized search, and Discovery releases. We’ve used it to model anticipated load for large events as well as the overall growth of our system over time. It’s also good for providing background traffic while other tests are running, simply to provide the correct mix of usage that we will encounter in production.

Acknowledgements & Future Work

Iago was primarily authored by James Waldrop (@hivetheory), but as with any such engineering effort a large number of people have contributed. A special thanks go out to the Finagle team, Marius Eriksen (@marius), Arya Asemanfar (@a_a), Evan Meagher (@evanm), Trisha Quan (@trisha) and Stephan Zuercher (@zuercher) for being tireless consumers as well as contributors to the project. Furthermore, we’d like to thank Raffi Krikorian (@raffi) and Dave Loftesness (@dloft) for originally envisioning and spearheading the effort to create Iago.

To view the Iago source code and participate in the creation and development of our roadmap, please visit Iago on GitHub. If you have any further questions, we suggest joining the mailing list and following @iagoloadgen. If you’re at the Velocity Conference this week in San Francisco, please swing by our office hours to learn more about Iago.

- Chris Aniszczyk, Manager of Open Source (@cra)

Wednesday, June 13, 2012

Twitter at the Hadoop Summit


Apache Hadoop is a fundamental part of Twitter infrastructure. The massive computational and storage capacity it provides us is invaluable for analyzing our data sets, continuously improving user experience, and powering features such as "who to follow" recommendations, tailored follow suggestions for new users and "best of Twitter" emails. We developed and open-sourced a number of technologies, including the recent Elephant Twin project that help our engineers be productive with Hadoop. We will be talking about some of them at the Hadoop Summit this week:

Real-time analytics with Storm and Hadoop (@nathanmarz)
Storm is a distributed and fault-tolerant real-time computation system, doing for real-time computation what Hadoop did for batch computation. Storm can be used together with Hadoop to make a potent realtime analytics stack; Nathan will discuss how we’ve combined the two technologies at Twitter to do complex analytics in real-time.

Training a Smarter Pig: Large-Scale Machine Learning at Twitter (@lintool)
We’ll present a case study of Twitter`s integration of machine learning tools into its existing Hadoop-based, Pig-centric analytics platform. In our deployed solution, common machine learning tasks such as data sampling, feature generation, training, and testing can be accomplished directly in Pig, via carefully crafted loaders, storage functions, and user-defined functions. This means that machine learning is just another Pig script, which allows seamless integration with existing infrastructure for data management, scheduling, and monitoring in a production environment. This talk is based on a paper we presented at SIGMOD 2012.

Scalding: Twitter`s new DSL for Hadoop (@posco)
Hadoop uses a functional programming model to represent large-scale distributed computation. Scala is thus a very natural match for Hadoop. We will present Scalding, which is built on top of Cascading. Scalding brings an API very similar to Scala`s collection API to allow users to write jobs as they might locally and run those Jobs at scale. This talk will present the Scalding DSL and show some example jobs for common use cases.

Hadoop and Vertica: The Data Analytics Platform at Twitter (@billgraham)
Our data analytics platform uses a number of technologies, including Hadoop, Pig, Vertica, MySQL and ZooKeeper, to process hundreds of terabytes of data per day. Hadoop and Vertica are key components of the platform. The two systems are complementary, but their inherent differences create integration challenges. This talk is an overview of the overall system architecture focusing on integration details, job coordination and resource management.

Flexible In-Situ Indexing for Hadoop via Elephant Twin (@squarecog)
Hadoop workloads can be broadly divided into two types: large aggregation queries that involve scans through massive amounts of data, and selective “needle in a haystack” queries that significantly restrict the number of records under consideration. Secondary indexes can greatly increase processing speed for queries of the second type. We will present Twitter`s generic, extensible in-situ indexing framework Elephant Twin which was just open sourced: unlike “trojan layouts,” no data copying is necessary, and unlike Hive, our integration at the Hadoop API level means that all layers in the stack above can benefit from indexes.

As you can tell, our uses of Hadoop are wide and varied. We are looking forward to exchanging notes with other practitioners and learning about upcoming developments in the Hadoop ecosystem. Hope to see you there and if this sort of thing gets you excited, reach out to us, as we are hiring!

- Dmitriy Ryaboy, Engineering Manager, Analytics (@squarecog)

Thursday, June 7, 2012

Distributed Systems Tracing with Zipkin

Zipkin is a distributed tracing system that we created to help us gather timing data for all the disparate services involved in managing a request to the Twitter API. As an analogy, think of it as a performance profiler, like Firebug, but tailored for a website backend instead of a browser. In short, it makes Twitter faster. Today we’re open sourcing Zipkin under the APLv2 license to share a useful piece of our infrastructure with the open source community and gather feedback.


What can Zipkin do for me?

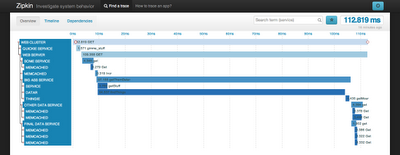
Here’s the Zipkin web user interface. This example displays the trace view for a web request. You can see the time spent in each service compared to the scale on top and all the services involved in the request on the left. You can click on those for more detailed information.


Zipkin has helped us find a whole slew of untapped performance optimizations, such as removing memcache requests, rewriting slow MySQL SELECTs, and fixing incorrect service timeouts. Finding and correcting these types of performance bottlenecks helps make Twitter faster.

How does Zipkin work?

Whenever a request reaches Twitter, we decide if the request should be sampled. We attach a few lightweight trace identifiers and pass them along to all the services used in that request. By only sampling a portion of all the requests we reduce the overhead of tracing, allowing us to always have it enabled in production.

The Zipkin collector receives the data via Scribe and stores it in Cassandra along with a few indexes. The indexes are used by the Zipkin query daemon to find interesting traces to display in the web UI.

Zipkin started out as a project during our first Hack Week. During that week we implemented a basic version of the Google Dapper paper for Thrift. Today it has grown to include support for tracing Http, Thrift, Memcache, SQL and Redis requests. These are mainly done via our Finagle library in Scala and Java, but we also have a gem for Ruby that includes basic tracing support. It should be reasonably straightforward to add tracing support for other protocols and in other libraries.

Acknowledgements

Zipkin was primarily authored by Johan Oskarsson (@skr) and Franklin Hu (@thisisfranklin). The project relies on a bunch of Twitter libraries such as Finagle and Scrooge but also on Cassandra for storage, ZooKeeper for configuration, Scribe for transport, Bootstrap and D3 for the UI. Thanks to the authors of those projects, the authors of the Dapper paper as well as the numerous people at Twitter involved in making Zipkin a reality. A special thanks to @iano, @couch, @zed, @dmcg, @marius and @a_a for their involvement. Last but not least we’d like to thank @jeajea for designing the Zipkin logo.

On the whole, Zipkin was initially targeted to support Twitter’s infrastructure of libraries and protocols, but can be extended to support more systems that can be used within your infrastructure. Please let us know on Github if you find any issues and pull requests are always welcome. If you want to stay in touch, follow @ZipkinProject and check out the upcoming talk at Strange Loop 2012. If distributed systems tracing interests you, consider joining the flock to make things better.

- Chris Aniszczyk, Manager of Open Source (@cra)

Monday, June 4, 2012

Studying rapidly evolving user interests

Twitter is an amazing real-time information dissemination platform. We've seen events of historical importance such as the Arab Spring unfold via Tweets. We even know that Twitter is faster than earthquakes! However, can we more scientifically characterize the real-time nature of Twitter?

One way to measure the dynamics of a content system is to test how quickly the distribution of terms and phrases appearing in it changes. A recent study we've done does exactly this: looking at terms and phrases in Tweets and in real-time search queries, we see that the most frequent terms in one hour or day tend to be very different from those in the next — significantly more so than in other content on the web. Informally, we call this phenomenon churn.

This week, we are presenting a short paper at the International Conference on Weblogs and Social Media (ICWSM 2012), in which @gilad and I examine this phenomenon. An extended version of the paper, titled "A Study of 'Churn' in Tweets and Real-Time Search Queries", is available here. Some highlights:

  • Examining all search queries from October 2011, we see that, on average, about 17% of the top 1000 query terms from one hour are no longer in the top 1000 during the next hour. In other words, 17% of the top 1000 query terms "churn over" on an hourly basis.
  • Repeating this at a granularity of days instead of hours, we still find that about 13% of the top 1000 query terms from one day are no longer in the top 1000 during the next day.
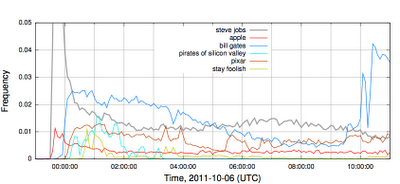
  • During major events, the frequency of queries spike dramatically. For example, on October 5, immediately following news of the death of Apple co-founder and CEO Steve Jobs, the query "steve jobs" spiked from a negligible fraction of query volume to 15% of the query stream — almost one in six of all queries issued! Check it out: the query volume is literally off the charts! Notice that related queries such as "apple" and "stay foolish" spiked as well.


What does this mean? News breaks on Twitter, whether local or global, of narrow or broad interest. When news breaks, Twitter users flock to the service to find out what's happening. Our goal is to instantly connect people everywhere to what's most meaningful to them; the speed at which our content (and the relevance signals stemming from it) evolves make this more technically challenging, and we are hard at work continuously refining our relevance algorithms to address this. Just to give one example: search, boiled down to its basics, is about computing term statistics such as term frequency and inverse document frequency. Most algorithms assume some static notion of underlying distributions — which surely isn't the case here!

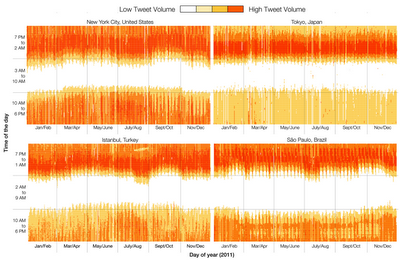
In addition, we're presenting a paper at the co-located workshop on Social Media Visualization, where @miguelrios and I share some of our experiences in using data visualization techniques to generate insights from the petabytes of data in our data warehouse. You've seen some of these visualizations before, for example, about the 2010 World Cup and 2011 Japan earthquake. In the paper, we present another visualization, of seasonal variation of tweeting patterns for users in four different cities (New York City, Tokyo, Istanbul, and Sao Paulo). The gradient from white to yellow to red indicates amount of activity (light to heavy). Each tile in the heatmap represents five minutes of a given day and colors are normalized by day. This was developed internally to understand why growth patterns in Tweet-production experience seasonal variations.


We see different patterns of activity between the four cities. For example, waking/sleeping times are relatively constant throughout the year in Tokyo, but the other cities exhibit seasonal variations. We see that Japanese users' activities are concentrated in the evening, whereas in the other cities there is more usage during the day. In Istanbul, nights get shorter during August; Sao Paulo shows a time interval during the afternoon when Tweet volume goes down, and also longer nights during the entire year compared to the other three cities.

Finally, we're also giving a keynote at the co-located workshop on Real-Time Analysis and Mining of Social Streams (RAMSS), fitting very much into the theme of our study. We'll be reviewing many of the challenges of handling real-time data, including many of the issues described above.

Interested in real-time systems that deliver relevant information to users? Interested in data visualization and data science? We're hiring! Join the flock!

- Jimmy Lin, Research Scientist, Analytics (@lintool)

Tuesday, May 29, 2012

Improving performance on twitter.com

To connect you to information in real time, it’s important for Twitter to be fast. That’s why we’ve been reviewing our entire technology stack to optimize for speed.

When we shipped #NewTwitter in September 2010, we built it around a web application architecture that pushed all of the UI rendering and logic to JavaScript running on our users’ browsers and consumed the Twitter REST API directly, in a similar way to our mobile clients. That architecture broke new ground by offering a number of advantages over a more traditional approach, but it lacked support for various optimizations available only on the server.

To improve the twitter.com experience for everyone, we've been working to take back control of our front-end performance by moving the rendering to the server. This has allowed us to drop our initial page load times to 1/5th of what they were previously and reduce differences in performance across browsers.

On top of the rendered pages, we asynchronously bootstrap a new modular JavaScript application to provide the fully-featured interactive experience our users expect. This new framework will help us rapidly develop new Twitter features, take advantage of new browser technology, and ultimately provide the best experience to as many people as possible.

This week, we rolled out the re-architected version of one of our most visited pages, the Tweet permalink page. We’ll continue to roll out this new framework to the rest of the site in the coming weeks, so we'd like to take you on a tour of some of the improvements.

No more #!

The first thing that you might notice is that permalink URLs are now simpler: they no longer use the hashbang (#!). While hashbang-style URLs have a handful of limitations, our primary reason for this change is to improve initial page-load performance.

When you come to twitter.com, we want you to see content as soon as possible. With hashbang URLs, the browser needs to download an HTML page, download and execute some JavaScript, recognize the hashbang path (which is only visible to the browser), then fetch and render the content for that URL. By removing the need to handle routing on the client, we remove many of these steps and reduce the time it takes for you to find out what’s happening on twitter.com.

Reducing time to first tweet

Before starting any of this work we added instrumentation to find the performance pain points and identify which categories of users we could serve better. The most important metric we used was "time to first Tweet". This is a measurement we took from a sample of users, (using the Navigation Timing API) of the amount of time it takes from navigation (clicking the link) to viewing the first Tweet on each page's timeline. The metric gives us a good idea of how snappy the site feels.

Looking at the components that make up this measurement, we discovered that the raw parsing and execution of JavaScript caused massive outliers in perceived rendering speed. In our fully client-side architecture, you don’t see anything until our JavaScript is downloaded and executed. The problem is further exacerbated if you do not have a high-specification machine or if you’re running an older browser. The bottom line is that a client-side architecture leads to slower performance because most of the code is being executed on our users' machines rather than our own.

There are a variety of options for improving the performance of our JavaScript, but we wanted to do even better. We took the execution of JavaScript completely out of our render path. By rendering our page content on the server and deferring all JavaScript execution until well after that content has been rendered, we've dropped the time to first Tweet to one-fifth of what it was.

Loading only what we need

Now that we’re delivering page content faster, the next step is to ensure that our JavaScript is loaded and the application is interactive as soon as possible. To do that, we need to minimize the amount of JavaScript we use: smaller payload over the wire, fewer lines of code to parse, faster to execute. To make sure we only download the JavaScript necessary for the page to work, we needed to get a firm grip on our dependencies.

To do this, we opted to arrange all our code as CommonJS modules, delivered via AMD. This means that each piece of our code explicitly declares what it needs to execute which, firstly, is a win for developer productivity. When working on any one module, we can easily understand what dependencies it relies on, rather than the typical browser JavaScript situation in which code depends on an implicit load order and globally accessible properties.

Modules let us separate the loading and the evaluation of our code. This means that we can bundle our code in the most efficient manner for delivery and leave the evaluation order up to the dependency loader. We can tune how we bundle our code, lazily load parts of it, download pieces in parallel, separate it into any number of files, and more — all without the author of the code having to know or care about this. Our JavaScript bundles are built programmatically by a tool, similar to the RequireJS optimizer, that crawls each file to build a dependency tree. This dependency tree lets us design how we bundle our code, and rather than downloading the kitchen sink every time, we only download the code we need — and then only execute that code when required by the application.

What's next?

We're currently rolling out this new architecture across the site. Once our pages are running on this new foundation, we will do more to further improve performance. For example, we will implement the History API to allow partial page reloads in browsers that support it, and begin to overhaul the server side of the application.

If you want to know more about these changes, come and see us at the Fluent Conference next week. We’ll speak about the details behind our rebuild of twitter.com and host a JavaScript Happy Hour at Twitter HQ on May 31.


-Dan Webb, Engineering Manager, Web Core team (@danwrong)