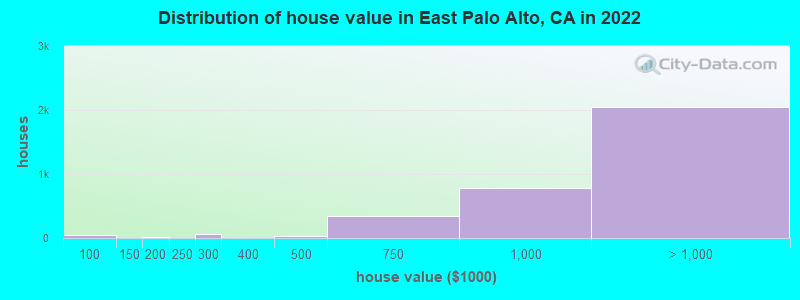
Estimated median house or condo value in 2017: $710,992 (it was $296,700 in 2000)
East Palo Alto:
$710,992
CA:
$509,400
Mean prices in 2017:all housing units: over $1,000,000; detached houses: over $1,000,000; townhouses or other attached units: $946,532; in 2-unit structures: $930,101; in 3-to-4-unit structures: $748,471; in 5-or-more-unit structures: $725,975; mobile homes: $170,620; occupied boats, rvs, vans, etc.: $58,879
Median gross rent in 2017: $1,846.
March 2019 cost of living index in East Palo Alto: 169.9 (very high, U.S. average is 100)
Percentage of residents living in poverty in 2017: 13.7%
(9.4% for White Non-Hispanic residents, 14.7% for Black residents, 13.3% for Hispanic or Latino residents, 7.4% for American Indian residents, 14.2% for Native Hawaiian and other Pacific Islander residents, 13.6% for other race residents, 24.2% for two or more races residents)
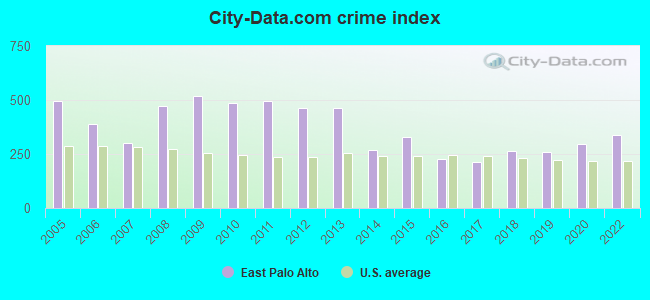
City-Data.com crime index (higher means more crime, U.S. average = 274.0)
635.7
496.0
384.6
472.8
519.4
398.4
495.6
462.1
462.6
268.8
330.3
228.9
213.8
264.8
The City-Data.com crime rate weighs serious crimes and violent crimes more heavily. It adjusts for the number of visitors and daily workers commuting into cities.
Latest news from East Palo Alto, CA collected exclusively by city-data.com from local newspapers, TV, and radio stations
Current Local Time: PST time zone
Elevation: 15 feet
Land area: 2.55 square miles.
Population density: 11,687 people per square mile (high).
12,894 residents are foreign born (32.9% Latin America, 5.5% Oceania).
This city:
43.0%
California:
27.0%
Median real estate property taxes paid for housing units with mortgages in 2017: $6,082 (0.8%) Median real estate property taxes paid for housing units with no mortgage in 2017: $2,593 (0.4%)
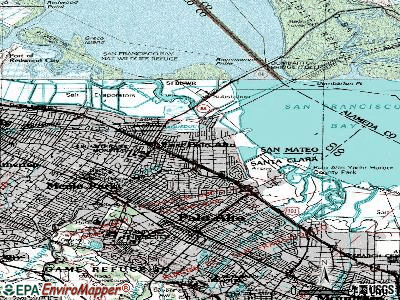
Nearest city with pop. 50,000+: Palo Alto, CA (2.6 miles , pop. 58,598).
Nearest city with pop. 200,000+: Fremont, CA (10.1 miles , pop. 203,413).
Nearest city with pop. 1,000,000+: Los Angeles, CA (315.0 miles , pop. 3,694,820).
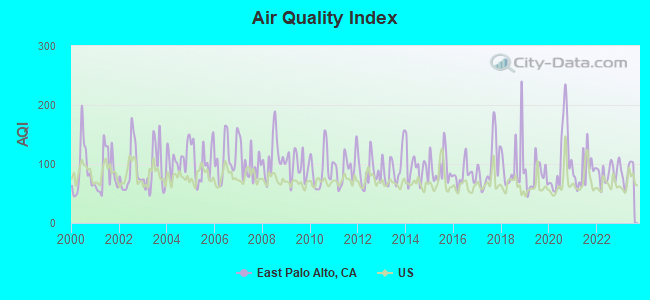
Air Quality Index (AQI) level in 2018 was 98.8. This is worse than average.
City:
98.8
U.S.:
74.2
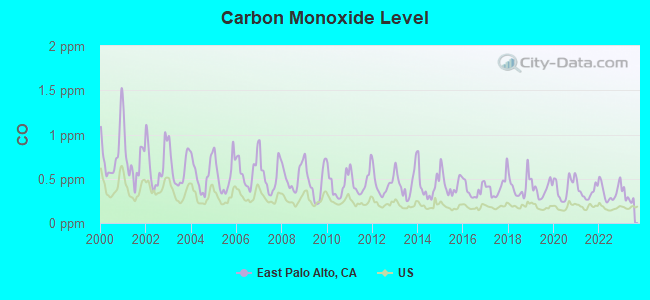
Carbon Monoxide (CO) [ppm] level in 2018 was 0.413. This is significantly worse than average.Closest monitor was 3.7 miles away from the city center.
City:
0.413
U.S.:
0.267
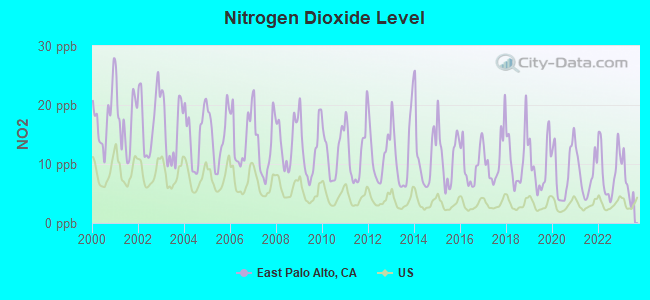
Nitrogen Dioxide (NO2) [ppb] level in 2018 was 11.0. This is significantly worse than average.Closest monitor was 3.7 miles away from the city center.
City:
11.0
U.S.:
5.6
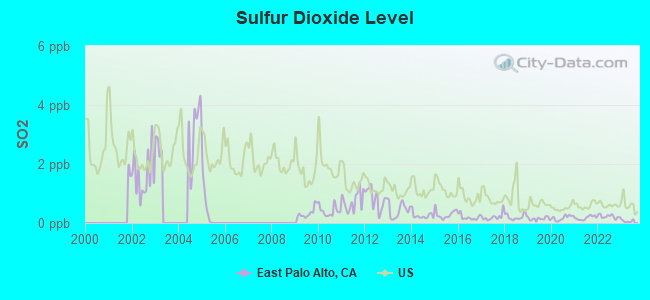
Sulfur Dioxide (SO2) [ppb] level in 2018 was 0.209. This is significantly better than average.Closest monitor was 11.0 miles away from the city center.
City:
0.209
U.S.:
1.789
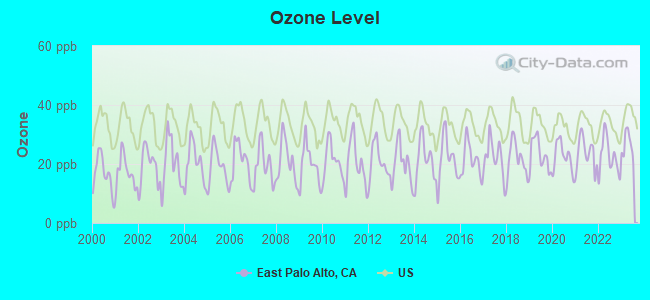
Ozone [ppb] level in 2018 was 21.6. This is significantly better than average.Closest monitor was 3.7 miles away from the city center.
City:
21.6
U.S.:
33.3
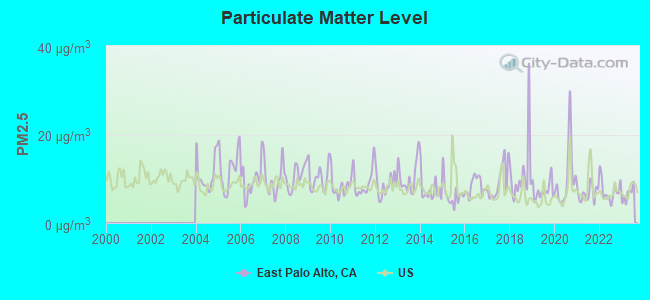
Particulate Matter (PM2.5) [µg/m3] level in 2018 was 11.1. This is worse than average.Closest monitor was 3.7 miles away from the city center.
City:
11.1
U.S.:
8.5
Lead (Pb) [µg/m3] level in 2018 was 0.00611. This is significantly better than average.Closest monitor was 3.7 miles away from the city center.
City:
0.00611
U.S.:
0.00984
Earthquake activity:
East Palo Alto-area historical earthquake activity is near California state average. It is 754% greater than the overall U.S. average.
On 4/18/1906 at 13:12:21, a magnitude 7.9 (7.9 UK, Class: Major, Intensity: VIII - XII) earthquake occurred 59.8 miles away from the city center, causing $524,000,000 total damage On 10/18/1989 at 00:04:15, a magnitude 7.1 (6.5 MB, 7.1 MS, 6.9 MW, 7.0 ML) earthquake occurred 32.0 miles away from the city center, causing 62 deaths (62 shaking deaths) and 3757 injuries, causing $1,305,032,704 total damage On 11/4/1927 at 13:51:53, a magnitude 7.5 (7.5 UK) earthquake occurred 187.0 miles away from the city center On 7/21/1952 at 11:52:14, a magnitude 7.7 (7.7 UK) earthquake occurred 244.5 miles away from the city center, causing $50,000,000 total damage On 1/31/1922 at 13:17:28, a magnitude 7.6 (7.6 UK) earthquake occurred 289.1 miles away from the city center On 4/25/1992 at 18:06:04, a magnitude 7.2 (6.3 MB, 7.1 MS, 7.2 MW, 7.1 MW, Depth: 9.4 mi) earthquake occurred 224.8 miles away from East Palo Alto center, causing $75,000,000 total damage Magnitude types: body-wave magnitude (MB), local magnitude (ML), surface-wave magnitude (MS), moment magnitude (MW)
Natural disasters:
The number of natural disasters in San Mateo County (14) is near the US average (13). Major Disasters (Presidential) Declared: 11 Emergencies Declared: 2
Causes of natural disasters: Floods: 9, Storms: 6, Landslides: 4, Mudslides: 3, Winter Storms: 3, Drought: 1, Earthquake: 1, Fire: 1, Freeze: 1, Hurricane: 1, Tornado: 1 (Note: some incidents may be assigned to more than one category).
Main business address for: GREATER BAY BANCORP (NATIONAL COMMERCIAL BANKS).
Hospitals and medical centers near East Palo Alto:
SATELLITE DIALYSIS MENLO PARK (Dialysis Facility, about 1 miles away; MENLO PARK, CA)
WELLBOUND OF MENLO PARK LLC (Dialysis Facility, about 2 miles away; MENLO PARK, CA)
MENLO PARK SURGICAL HOSPITAL Acute Care Hospitals (about 2 miles away; MENLO PARK, CA)
LYTTON GARDENS HEALTH CARE CENTER (Nursing Home, about 2 miles away; PALO ALTO, CA)
PALO ALTO NURSING CENTER (Nursing Home, about 2 miles away; PALO ALTO, CA)
CASA OLGA INTERMEDIATE HEALTH CARE FACILITY (Nursing Home, about 3 miles away; PALO ALTO, CA)
SURGECENTER OF PALO ALTO (Hospital, about 3 miles away; PALO ALTO, CA)
Amtrak stations near East Palo Alto:
10 miles: FREMONT (CENTERVILLE, FREMONT & PERALTA BLVDS.) . Services: fully wheelchair accessible, enclosed waiting area, public restrooms, public payphones, snack bar, free short-term parking, free long-term parking, call for car rental service, call for taxi service, public transit connection.
13 miles: SANTA CLARA-GREAT AMERICA (SANTA CLARA, FOOT OF STARS & STRIPES DR.) . Services: partially wheelchair accessible, free short-term parking.
13 miles: FREEMONT-MISSION SAN JOSE (FREMONT, MISSION BLVD. & I-680) - Bus Station . Services: fully wheelchair accessible, public payphones, free short-term parking, call for taxi service, public transit connection.
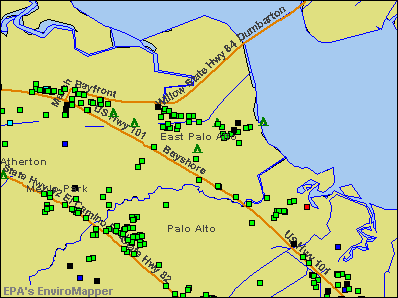
Notable locations in East Palo Alto: East Palo Alto City Hall (A), East Palo Alto Branch San Mateo County Library (B), Menlo Park Fire Protection District Station 2 (C). Display/hide their locations on the map
Churches in East Palo Alto include: Saint Mark's Missionary Baptist Church (A), Saint John Baptist Church (B), Saint Francis of Assisi Church (C), Community Church (D). Display/hide their locations on the map
Hotel: Four Seasons Hotel Silicon Valley at East Palo Alto (2050 University Ave).
Birthplace of: Eugene Jackson (fighter) - Martial artist, Devin Wyman - Football defensive tackle, Calvin Brown - College basketball player (Utah State Aggies).
San Mateo County has a predicted average indoor radon screening level between 2 and 4 pCi/L (pico curies per liter) - Moderate Potential
Drinking water stations with addresses in East Palo Alto and their reported violations in the past:
MCL, Monthly (TCR) - In DEC-2008, Contaminant: Coliform. Follow-up actions: St Compliance achieved (JAN-21-2009)
MCL, Monthly (TCR) - In SEP-2008, Contaminant: Coliform. Follow-up actions: St Compliance achieved (OCT-21-2008)
Past monitoring violations:
One routine major monitoring violation
One minor monitoring violation
Average household size:
This city:
4.0 people
California:
2.9 people
Percentage of family households:
This city:
76.1%
Whole state:
68.7%
Percentage of households with unmarried partners:
This city:
8.5%
Whole state:
7.2%
Likely homosexual households (counted as self-reported same-sex unmarried-partner households)
Lesbian couples: 0.4% of all households
Gay men: 0.4% of all households
People in group quarters in East Palo Alto in 2010:
60 people in other noninstitutional facilities
41 people in group homes intended for adults
33 people in residential treatment centers for adults
11 people in emergency and transitional shelters (with sleeping facilities) for people experiencing homelessness
5 people in workers' group living quarters and job corps centers
4 people in group homes for juveniles (non-correctional)
People in group quarters in East Palo Alto in 2000:
64 people in homes or halfway houses for drug/alcohol abuse
41 people in nursing homes
37 people in other noninstitutional group quarters
18 people in homes for the mentally ill
16 people in other nonhousehold living situations
11 people in other group homes
2 people in religious group quarters
Banks with branches in East Palo Alto (2011 data):
California Bank & Trust: East Palo Alto Branch at 1735 East Bayshore Road, branch established on 2002/02/25. Info updated 2009/07/20: Bank assets: $10,894.1 mil, Deposits: $9,193.9 mil, headquarters in San Diego, CA, positive income, Commercial Lending Specialization, 109 total offices, Holding Company: Zions Bancorporation
Bank Leumi USA: East Palo Alto Branch at 2000 University Avenue, Suite 605, branch established on 2003/09/02. Info updated 2010/11/03: Bank assets: $5,680.4 mil, Deposits: $4,855.4 mil, headquarters in New York, NY, positive income, Commercial Lending Specialization, 12 total offices, Holding Company: Bank Leumi Le-Israel B.M.
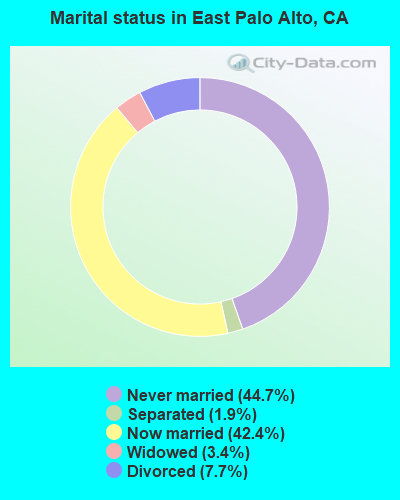
For population 15 years and over in East Palo Alto:
Never married: 45.9%
Now married: 41.7%
Separated: 2.6%
Widowed: 3.1%
Divorced: 6.6%
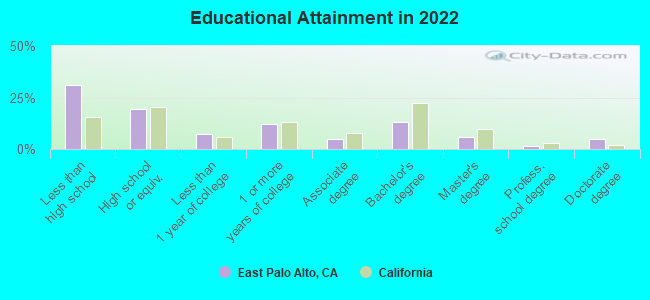
For population 25 years and over in East Palo Alto:
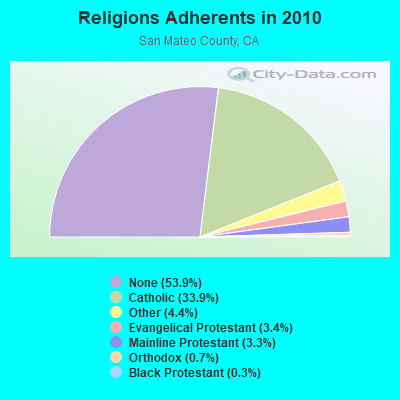
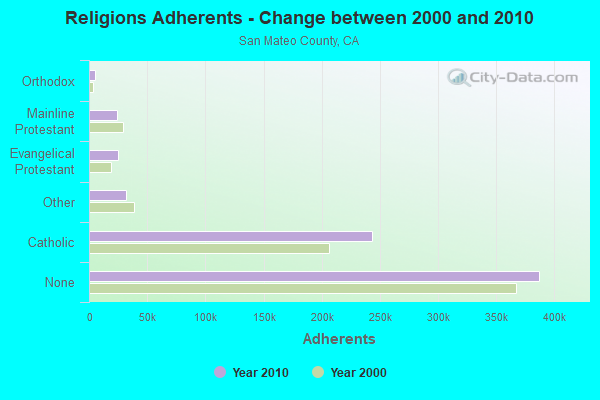
Religion statistics for East Palo Alto, CA (based on San Mateo County data)
Religion
Adherents
Congregations
Catholic
243,634
22
Other
31,697
78
Evangelical Protestant
24,771
166
Mainline Protestant
23,840
74
Orthodox
5,350
5
Black Protestant
2,046
12
None
387,113
-
Source: Clifford Grammich, Kirk Hadaway, Richard Houseal, Dale E.Jones, Alexei Krindatch, Richie Stanley and Richard H.Taylor. 2012. 2010 U.S.Religion Census: Religious Congregations & Membership Study. Association of Statisticians of American Religious Bodies. Jones, Dale E., et al. 2002. Congregations and Membership in the United States 2000. Nashville, TN: Glenmary Research Center. Graphs represent county-level data
STATION, Corner Of Bay And University Avenue (Lat: 37.471583 Lon: -122.144389), Structure height: 13.4 m, Overall height: 14 m, Call Sign: WNET954, Assigned Frequencies: 18925.0 MHz, Grant Date: 09/26/2017, Expiration Date: 12/17/2027, Registrant: San Mateo County, 455 County Center, Redwood City, CA 94063, Phone: (650) 599-1030, Email:
East Palo Alto, 2415 University Avenue (Lat: 37.472417 Lon: -122.138556), Type: Pipe, Structure height: 15.5 m, Call Sign: WPTL684, Assigned Frequencies: 10995.0 MHz, 10875.0 MHz, Grant Date: 08/06/2011, Expiration Date: 10/26/2021, Certifier: Steven H Green, Registrant: Local Radio Networks, 206 Lakeview Way, Redwood City, CA 94062, Phone: (650) 368-3800, Fax: (650) 368-3803, Email:
CLIENT, 1950 University Ave (Lat: 37.459306 Lon: -122.141806), Type: Building, Structure height: 30.5 m, Call Sign: WQTY679, Assigned Frequencies: 10995.0 MHz, 10995.0 MHz, 10995.0 MHz, 10995.0 MHz, 10995.0 MHz, 10995.0 MHz, 10995.0 MHz, 10995.0 MHz, 10995.0 MHz, Grant Date: 05/07/2014, Expiration Date: 05/07/2024, Certifier: William A Hagen, Registrant: Etheric Networks Inc, 899 Arguello Street, Redwood City, CA 94063, Phone: (650) 399-4201, Fax: (650) 472-9225, Email:
Aircraft: DAVIS JOHN R VANS RV-8 (Category: Land, Seats: 2, Weight: Up to 12,499 Pounds), Engine: SUPERIOR XP-360 (170 HP) (4 Cycle) N-Number: 114NH , Serial Number: 82137, Airworthiness Date: 11/15/2007, Certificate Issue Date: 08/10/2017 Registrant (Individual): Anthony Sagneri, 1765 E Bayshore Rd Unit 204, East Palo Alto, CA 94303
Home Mortgage Disclosure Act Aggregated Statistics For Year 2009 (Based on 2 full and 1 partial tracts)
A) FHA, FSA/RHS & VA Home Purchase Loans
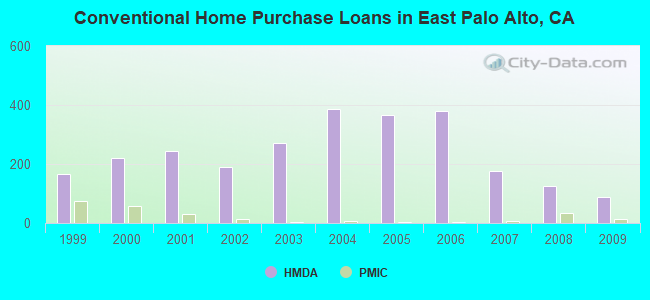
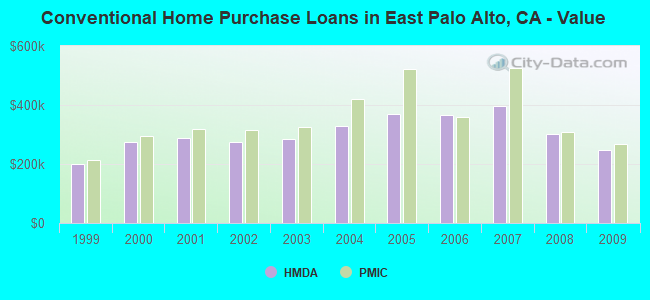
B) Conventional Home Purchase Loans
C) Refinancings
D) Home Improvement Loans
F) Non-occupant Loans on < 5 Family Dwellings (A B C & D)
G) Loans On Manufactured Home Dwelling (A B C & D)
Number
Average Value
Number
Average Value
Number
Average Value
Number
Average Value
Number
Average Value
Number
Average Value
LOANS ORIGINATED
44
$283,461
87
$247,501
154
$332,801
7
$167,866
51
$220,316
0
$0
APPLICATIONS APPROVED, NOT ACCEPTED
9
$306,993
17
$217,771
37
$333,895
1
$180,000
10
$224,645
0
$0
APPLICATIONS DENIED
31
$285,985
21
$300,010
100
$360,075
4
$113,658
19
$215,293
1
$84,070
APPLICATIONS WITHDRAWN
9
$269,362
7
$258,241
40
$290,853
1
$148,350
11
$230,774
0
$0
FILES CLOSED FOR INCOMPLETENESS
5
$257,394
5
$236,538
16
$345,119
0
$0
1
$185,930
0
$0
Aggregated Statistics For Year 2008 (Based on 2 full and 1 partial tracts)
A) FHA, FSA/RHS & VA Home Purchase Loans
B) Conventional Home Purchase Loans
C) Refinancings
D) Home Improvement Loans
F) Non-occupant Loans on < 5 Family Dwellings (A B C & D)
G) Loans On Manufactured Home Dwelling (A B C & D)
Number
Average Value
Number
Average Value
Number
Average Value
Number
Average Value
Number
Average Value
Number
Average Value
LOANS ORIGINATED
23
$302,677
125
$301,431
145
$332,493
4
$317,520
43
$268,363
2
$75,920
APPLICATIONS APPROVED, NOT ACCEPTED
4
$251,700
35
$303,008
50
$351,734
4
$371,038
15
$268,181
3
$80,427
APPLICATIONS DENIED
10
$372,258
78
$328,512
186
$360,878
19
$130,206
34
$298,676
3
$95,363
APPLICATIONS WITHDRAWN
12
$285,472
37
$283,270
42
$361,969
6
$210,163
13
$253,607
0
$0
FILES CLOSED FOR INCOMPLETENESS
1
$296,700
12
$293,341
26
$376,697
5
$332,290
7
$219,030
0
$0
Aggregated Statistics For Year 2007 (Based on 2 full and 1 partial tracts)
B) Conventional Home Purchase Loans
C) Refinancings
D) Home Improvement Loans
E) Loans on Dwellings For 5+ Families
F) Non-occupant Loans on < 5 Family Dwellings (A B C & D)
G) Loans On Manufactured Home Dwelling (A B C & D)
Number
Average Value
Number
Average Value
Number
Average Value
Number
Average Value
Number
Average Value
Number
Average Value
LOANS ORIGINATED
176
$395,041
468
$398,979
60
$350,748
1
$13,505,780
85
$388,075
3
$66,753
APPLICATIONS APPROVED, NOT ACCEPTED
65
$338,795
126
$432,140
9
$418,213
0
$0
25
$438,584
6
$106,392
APPLICATIONS DENIED
159
$406,271
378
$451,085
46
$333,299
0
$0
43
$435,828
7
$114,456
APPLICATIONS WITHDRAWN
31
$369,795
118
$426,689
13
$241,494
0
$0
14
$313,711
1
$90,990
FILES CLOSED FOR INCOMPLETENESS
12
$350,975
66
$440,037
10
$456,203
0
$0
6
$474,645
0
$0
Aggregated Statistics For Year 2006 (Based on 2 full and 1 partial tracts)
A) FHA, FSA/RHS & VA Home Purchase Loans
B) Conventional Home Purchase Loans
C) Refinancings
D) Home Improvement Loans
E) Loans on Dwellings For 5+ Families
F) Non-occupant Loans on < 5 Family Dwellings (A B C & D)
G) Loans On Manufactured Home Dwelling (A B C & D)
Number
Average Value
Number
Average Value
Number
Average Value
Number
Average Value
Number
Average Value
Number
Average Value
Number
Average Value
LOANS ORIGINATED
0
$0
380
$365,404
607
$410,371
93
$340,352
2
$1,512,645
116
$379,371
2
$197,450
APPLICATIONS APPROVED, NOT ACCEPTED
0
$0
94
$335,369
160
$407,924
15
$344,554
1
$1,218,770
30
$362,931
1
$105,820
APPLICATIONS DENIED
0
$0
242
$381,357
385
$426,955
72
$277,842
1
$1,694,570
55
$381,922
3
$93,467
APPLICATIONS WITHDRAWN
1
$144,000
71
$401,545
217
$398,477
22
$351,044
0
$0
20
$425,596
1
$396,000
FILES CLOSED FOR INCOMPLETENESS
0
$0
17
$399,760
68
$384,898
8
$474,049
0
$0
6
$305,698
0
$0
Aggregated Statistics For Year 2005 (Based on 2 full and 1 partial tracts)
B) Conventional Home Purchase Loans
C) Refinancings
D) Home Improvement Loans
E) Loans on Dwellings For 5+ Families
F) Non-occupant Loans on < 5 Family Dwellings (A B C & D)
G) Loans On Manufactured Home Dwelling (A B C & D)
Number
Average Value
Number
Average Value
Number
Average Value
Number
Average Value
Number
Average Value
Number
Average Value
LOANS ORIGINATED
366
$368,822
660
$380,012
84
$341,182
11
$1,832,011
117
$352,521
1
$54,400
APPLICATIONS APPROVED, NOT ACCEPTED
65
$343,548
121
$391,344
18
$200,798
1
$690,170
22
$363,203
1
$84,070
APPLICATIONS DENIED
194
$373,689
444
$404,250
53
$274,282
2
$850,370
55
$429,228
4
$138,708
APPLICATIONS WITHDRAWN
58
$384,746
251
$379,445
23
$241,533
3
$1,725,603
34
$361,924
1
$355,050
FILES CLOSED FOR INCOMPLETENESS
19
$352,072
112
$371,175
3
$386,930
1
$865,100
11
$354,441
0
$0
Aggregated Statistics For Year 2004 (Based on 2 full and 1 partial tracts)
B) Conventional Home Purchase Loans
C) Refinancings
D) Home Improvement Loans
E) Loans on Dwellings For 5+ Families
F) Non-occupant Loans on < 5 Family Dwellings (A B C & D)
G) Loans On Manufactured Home Dwelling (A B C & D)
Number
Average Value
Number
Average Value
Number
Average Value
Number
Average Value
Number
Average Value
Number
Average Value
LOANS ORIGINATED
388
$328,674
721
$327,215
57
$267,221
9
$1,907,518
112
$309,488
3
$66,273
APPLICATIONS APPROVED, NOT ACCEPTED
71
$296,823
176
$319,983
8
$187,570
1
$3,100,990
15
$294,182
3
$90,000
APPLICATIONS DENIED
175
$305,000
397
$331,872
53
$223,170
2
$678,465
55
$292,273
6
$138,790
APPLICATIONS WITHDRAWN
66
$295,354
295
$320,597
15
$131,743
1
$4,198,260
27
$303,019
1
$80,110
FILES CLOSED FOR INCOMPLETENESS
17
$288,001
103
$311,650
5
$298,282
1
$1,017,760
11
$359,595
0
$0
Aggregated Statistics For Year 2003 (Based on 2 full and 1 partial tracts)
A) FHA, FSA/RHS & VA Home Purchase Loans
B) Conventional Home Purchase Loans
C) Refinancings
D) Home Improvement Loans
E) Loans on Dwellings For 5+ Families
F) Non-occupant Loans on < 5 Family Dwellings (A B C & D)
Number
Average Value
Number
Average Value
Number
Average Value
Number
Average Value
Number
Average Value
Number
Average Value
LOANS ORIGINATED
0
$0
271
$285,577
1,118
$280,673
29
$76,784
7
$1,528,057
154
$241,383
APPLICATIONS APPROVED, NOT ACCEPTED
1
$88,000
47
$283,964
241
$277,074
6
$41,230
0
$0
19
$226,997
APPLICATIONS DENIED
0
$0
101
$287,122
447
$285,223
25
$75,516
0
$0
38
$286,854
APPLICATIONS WITHDRAWN
0
$0
42
$300,233
316
$260,340
6
$29,873
0
$0
21
$270,062
FILES CLOSED FOR INCOMPLETENESS
0
$0
11
$318,031
53
$273,566
2
$137,195
0
$0
14
$234,086
Aggregated Statistics For Year 2002 (Based on 2 full tracts)
A) FHA, FSA/RHS & VA Home Purchase Loans
B) Conventional Home Purchase Loans
C) Refinancings
D) Home Improvement Loans
E) Loans on Dwellings For 5+ Families
F) Non-occupant Loans on < 5 Family Dwellings (A B C & D)
Number
Average Value
Number
Average Value
Number
Average Value
Number
Average Value
Number
Average Value
Number
Average Value
LOANS ORIGINATED
2
$83,490
191
$275,382
694
$265,769
14
$70,945
0
$0
82
$231,356
APPLICATIONS APPROVED, NOT ACCEPTED
4
$85,733
42
$298,174
161
$259,777
5
$68,828
0
$0
19
$249,165
APPLICATIONS DENIED
1
$243,290
46
$264,227
264
$256,650
27
$31,180
1
$350,000
23
$188,264
APPLICATIONS WITHDRAWN
0
$0
30
$304,354
384
$266,306
11
$59,818
0
$0
15
$188,243
FILES CLOSED FOR INCOMPLETENESS
0
$0
16
$286,076
82
$265,001
0
$0
1
$276,920
7
$227,463
Aggregated Statistics For Year 2001 (Based on 2 full tracts)
B) Conventional Home Purchase Loans
C) Refinancings
D) Home Improvement Loans
E) Loans on Dwellings For 5+ Families
F) Non-occupant Loans on < 5 Family Dwellings (A B C & D)
Number
Average Value
Number
Average Value
Number
Average Value
Number
Average Value
Number
Average Value
LOANS ORIGINATED
244
$288,677
573
$244,879
39
$47,382
1
$572,000
80
$213,930
APPLICATIONS APPROVED, NOT ACCEPTED
60
$296,425
94
$253,193
4
$130,818
0
$0
13
$214,315
APPLICATIONS DENIED
89
$235,896
255
$243,407
61
$44,848
1
$346,150
22
$217,352
APPLICATIONS WITHDRAWN
65
$309,906
219
$240,445
17
$86,649
1
$579,000
9
$169,761
FILES CLOSED FOR INCOMPLETENESS
16
$331,656
111
$237,511
3
$93,753
0
$0
4
$245,190
Aggregated Statistics For Year 2000 (Based on 2 full tracts)
A) FHA, FSA/RHS & VA Home Purchase Loans
B) Conventional Home Purchase Loans
C) Refinancings
D) Home Improvement Loans
E) Loans on Dwellings For 5+ Families
F) Non-occupant Loans on < 5 Family Dwellings (A B C & D)
Number
Average Value
Number
Average Value
Number
Average Value
Number
Average Value
Number
Average Value
Number
Average Value
LOANS ORIGINATED
1
$122,000
220
$274,859
288
$200,712
45
$44,374
1
$613,180
49
$219,942
APPLICATIONS APPROVED, NOT ACCEPTED
0
$0
34
$269,919
68
$194,017
13
$67,521
0
$0
11
$191,625
APPLICATIONS DENIED
0
$0
79
$247,759
172
$191,543
49
$40,176
1
$544,000
29
$244,210
APPLICATIONS WITHDRAWN
0
$0
35
$259,842
153
$177,537
9
$38,674
0
$0
15
$194,571
FILES CLOSED FOR INCOMPLETENESS
0
$0
11
$231,028
145
$191,405
3
$33,187
0
$0
8
$190,445
Aggregated Statistics For Year 1999 (Based on 2 full and 2 partial tracts)
A) FHA, FSA/RHS & VA Home Purchase Loans
B) Conventional Home Purchase Loans
C) Refinancings
D) Home Improvement Loans
E) Loans on Dwellings For 5+ Families
F) Non-occupant Loans on < 5 Family Dwellings (A B C & D)
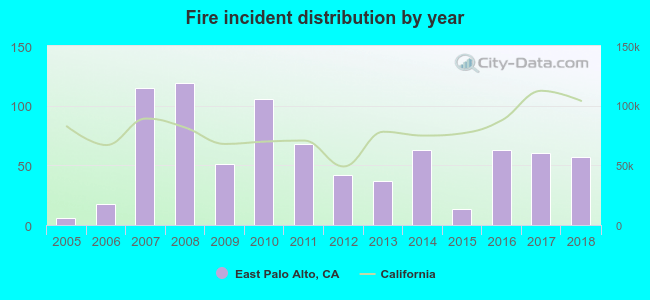
2005 - 2018 National Fire Incident Reporting System (NFIRS) incidents
Based on the data from the years 2005 - 2018 the average number of fires per year is 58. The highest number of fires - 119 took place in 2008, and the least - 6 in 2005. The data has an increasing trend.
When looking into fire subcategories, the most incidents belonged to: Outside Fires (35.7%), and Structure Fires (33.5%).
Fire incident types reported to NFIRS in East Palo Alto, CA
#13 on the list of "Top 101 cities with the most cars per house, population 5,000+"
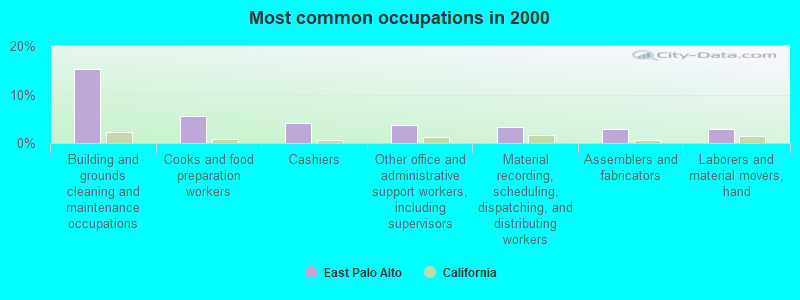
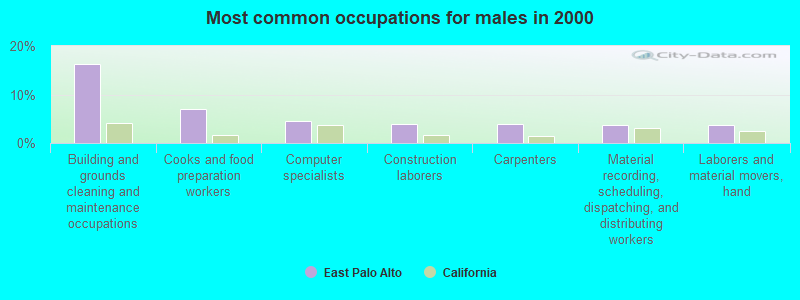
#16 on the list of "Top 101 cities with largest percentage of males in occupations: building and grounds cleaning and maintenance occupations (population 5,000+)"
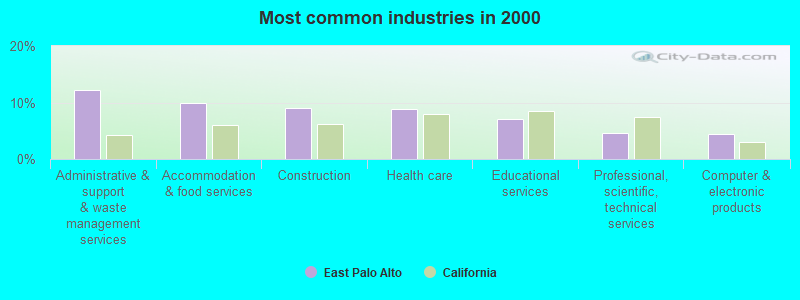
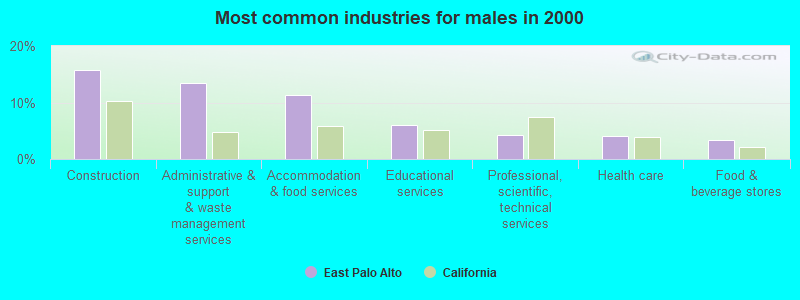
#16 on the list of "Top 101 cities with largest percentage of males in industries: administrative and support and waste management services (population 5,000+)"
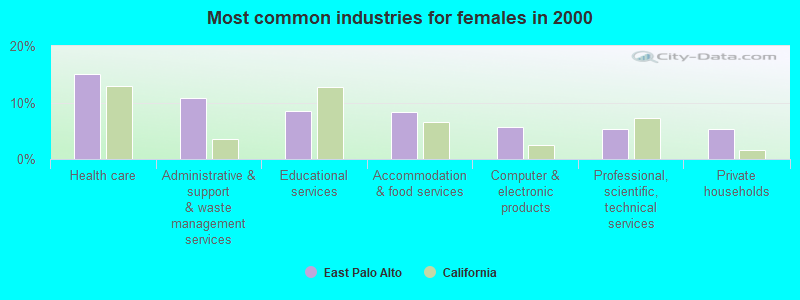
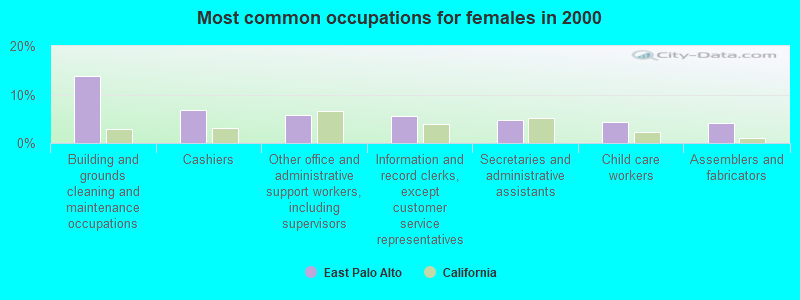
#17 on the list of "Top 101 cities with largest percentage of females in industries: administrative and support and waste management services (population 5,000+)"
#19 on the list of "Top 101 cities with the most residents born in Oceania (population 500+)"
#23 on the list of "Top 101 cities with largest percentage of females in occupations: personal care and service occupations (population 5,000+)"
#24 on the list of "Top 101 cities with the most residents born in Oceania, n.e.c. (population 500+)"
#29 on the list of "Top 101 cities with largest percentage of females in occupations: building and grounds cleaning and maintenance occupations (population 5,000+)"
#39 on the list of "Top 101 cities with the largest racial income disparity between any two races with at least 200 householders"
#67 on the list of "Top 101 cities with the largest city-data.com crime index per police officer (population 5,000+)"
#68 on the list of "Top 101 cities with the most residents born in Other Australian and New Zealand Subregion (population 500+)"
#73 on the list of "Top 101 cities with the most residents born in Other Northern Africa (population 500+)"
#6 on the list of "Top 101 counties with the highest percentage of residents that exercised in the past month"
#8 on the list of "Top 101 counties with the highest percentage of residents that drank alcohol in the past 30 days"
#9 on the list of "Top 101 counties with the lowest Ozone (1-hour) air pollution readings in 2012 (ppm)"
#10 on the list of "Top 101 counties with the highest carbon monoxide air pollution readings in 2012 (ppm)"
#11 on the list of "Top 101 counties with the lowest average weight of females"


 Recent articles from our blog. Our writers, many of them Ph.D. graduates or candidates, create easy-to-read articles on a wide variety of topics.


 (2.6 miles


 Based on the data from the years 2005 - 2018 the average number of fires per year is 58. The highest number of fires - 119 took place in 2008, and the least - 6 in 2005. The data has an increasing trend.
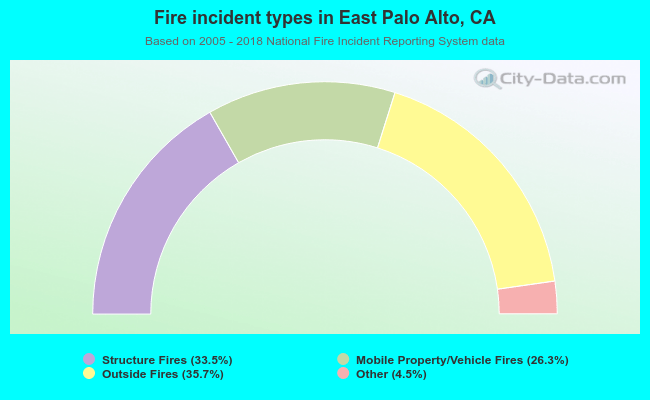 When looking into fire subcategories, the most incidents belonged to: Outside Fires (35.7%), and Structure Fires (33.5%).